Is water one liquid, or a mixture of two?
May 2026
Water is the most familiar liquid there is, and one of the strangest. It is densest at 4 °C, above its freezing point, and it gets easier to squeeze as it cools. For more than a century people have argued about why: is liquid water one continuous network of hydrogen bonds, or a mixture of two kinds of local arrangement that keep turning into each other?
We built an unsupervised machine-learning method to look for those two arrangements in simulated water, molecule by molecule. Its one rule is to leave room for doubt: a molecule that does not clearly belong to either group is set aside rather than forced into one.
The answer depends on temperature. In cold water the two groups are distinct, and they look different to X-rays; as the water warms, they merge into one. Both sides of the old argument are right, each in its own temperature range.
AT A GLANCE
QuestionIs liquid water one structure or two?Is liquid water one structure or two?
DataMolecular dynamics of 1,024 molecules, three water modelsMolecular dynamics of 1,024 molecules, three water models
FeaturesFour order parameters per moleculeFour order parameters per molecule
MethodGaussian mixture plus a likelihood-ratio thresholdGaussian mixture plus a likelihood-ratio threshold
Key resultTwo states in cold water that merge as it warmsTwo states in cold water that merge as it warms
StatusUnder review at PNASUnder review at PNAS
AdvisorBilin ZhuangBilin Zhuang
01. THE QUESTION
The argument is nearly as old as the subject. Röntgen proposed in 1892 that liquid water contains two forms; later, mixture models like Pauling's competed with Pople's picture of a single, continuously distorted network, and diffraction found evidence for both without ruling either out. Tanaka and colleagues gave the mixture side a concrete form: water keeps switching between locally favoured tetrahedral structures (LFTS), which are more ordered and less dense, and disordered normal-liquid structures (DNLS), which are denser and less ordered.
The catch is that the two overlap. Plot almost any structural measure and you see one broad hump rather than two clean peaks, so a hard cutoff cannot say which state a given molecule is in.
02. FOUR NUMBERS PER MOLECULE
We simulated 1,024 water molecules with the TIP4P/2005 model at −20 °C, three independent times, keeping 1,000 frames from each run: about a million snapshots of single molecules per run. Each molecule is then described by four standard order parameters, each scaled to the range 0 to 1.
ParameterWhat it measures
qHow close the four nearest neighbours come to a perfect tetrahedronHow close the four nearest neighbours come to a perfect tetrahedron
skHow evenly spaced those four neighbours areHow evenly spaced those four neighbours are
LSIHow clean the gap is between the first and second neighbour shellsHow clean the gap is between the first and second neighbour shells
ζHow far the nearest non-bonded neighbour sits beyond the hydrogen-bonded onesHow far the nearest non-bonded neighbour sits beyond the hydrogen-bonded ones
03. LEAVE ROOM FOR DOUBT
The obvious tools draw a hard line. K-means splits the molecules 58 to 42 percent, and a two-component Gaussian mixture gives essentially the same split, but both cut straight through a crowded region: their silhouette scores, which rate how much closer each molecule sits to its own group than to the other, are only 0.24 and 0.21.
So we keep the Gaussian mixture but change the decision. For each molecule we compare how likely its four numbers are under the high-ζ group H and under the low-ζ group L.
Λ(x) = log pH(x) − log pL(x)
A molecule joins H when Λ ≥ τ, joins L when Λ ≤ −τ, and is set aside as transitional otherwise. The sign of Λ alone decides the group, so τ only controls how many borderline molecules are held back. With τ = 2, about 10% are set aside, 32.5% land in H and 57.7% in L, and the silhouette rises to 0.340, the best of the methods we tried. Exhibit A runs the same rule on a toy version of the problem.
EXHIBIT A: LEAVING ROOM FOR DOUBT
TOY DATA: TWO OVERLAPPING STATES, 800 POINTSFITTED IN YOUR BROWSER
τ #0001
HIGH-ζ 30% · LOW-ζ 61% · SET ASIDE 9%SILHOUETTE 0.626
● HIGH-ζ GROUP○ LOW-ζ GROUP●SET ASIDE, |Λ| < τ
THE SIGN OF Λ PICKS THE GROUP; τ ONLY DECIDES HOW MANY BORDERLINE POINTS TO HOLD BACK. τ CYCLES UNTIL YOU PICK ONE.
04. CHECKING WITH X-RAYS
A clean split in feature space does not prove the two groups are physically different. For that we computed each group's structure factor S(k), the quantity measured in X-ray and neutron scattering, using only molecules from that group.
Si(k) = 1 + Σj≠i sin(k rij) / (k rij) · W(rij)
The H group shows a first sharp diffraction peak at k rOO/2π ≈ 0.82, the fingerprint of a tetrahedral network. The L group peaks at 1.06, where an ordinary dense liquid does, with no sharp peak at all. So H is the LFTS and L is the DNLS. The transitional molecules, treated the same way, give an almost featureless curve: they carry no structure of their own.
05. WARMING UP
Then we applied the same classifier, unchanged, to simulations from −30 °C to +90 °C. The tetrahedral state shrinks steadily as the water warms: it is 41% of the classified molecules at −30 °C, 16% at +30 °C and 7% at +90 °C. Its sharp diffraction peak fades too, while the dense state's peak barely moves; by room temperature the two structure factors are nearly indistinguishable.
Another way to see the merge: keeping the two groups equally well separated takes setting aside almost no molecules at −30 °C, but a third of the liquid at +30 °C. Cold water is a mixture of two structural states; warm water is one.
EXHIBIT B: WARMING UP
TIP4P/2005 WATER, −30 TO +90 °CNUMBERS FROM THE PAPER
TEMPERATURE: −30 °CSTEP 01 OF 13
LFTS SHARE 41.3%SET ASIDE AT FIXED QUALITY 1.1%
REPLAY SPEED
SOLID: TETRAHEDRAL (LFTS) SHARE OF THE CLASSIFIED MOLECULES, ONE CLASSIFIER FIXED AT −20 °C. DASHED: SHARE SET ASIDE TO KEEP THE TWO GROUPS EQUALLY SEPARATED, MEASURED TO +30 °C.
06. WHAT'S NEXT
The method has a single tunable parameter, τ, and it keeps the rule that sorts molecules separate from the measurement that checks the sort. The same picture holds in two other water models, TIP5P and SWM4-NDP. Nothing in it is specific to water, so it should carry over to other liquids, glasses and amorphous materials where structural states overlap.
NOTES
Are these real molecules?
They are simulated, with classical molecular dynamics of three standard water models. Exhibit A is a toy; Exhibit B plots numbers from the paper.
Why not just use K-means?
It draws a hard line through the crowded middle, so borderline molecules land in whichever group is nearer. Setting them aside keeps both groups clean.
Where are the code and data?
REFERENCES
[1]Y. Yao, D. Sanghi, A. D. Chokshi, S. Nathani, M. Jerricho, M. Choi, H. Wang and B. Zhuang. Is water a mixture: unsupervised likelihood-ratio classification reveals two water states that merge upon increasing temperature. Under review, PNAS, 2026.
[2]W. C. Röntgen. Ueber die Constitution des flüssigen Wassers. Annalen der Physik 281, 91–97, 1892.
[3]J. Russo and H. Tanaka. Understanding water's anomalies with locally favoured structures. Nature Communications 5, 3556, 2014.
[4]R. Shi and H. Tanaka. Distinct signature of local tetrahedral ordering in the scattering function of covalent liquids and glasses. Science Advances 5, eaav3194, 2019.
[5]P. Debye. Zerstreuung von Röntgenstrahlen. Annalen der Physik 351, 809–823, 1915.
APPENDIX: FIGURES FROM THE PAPER
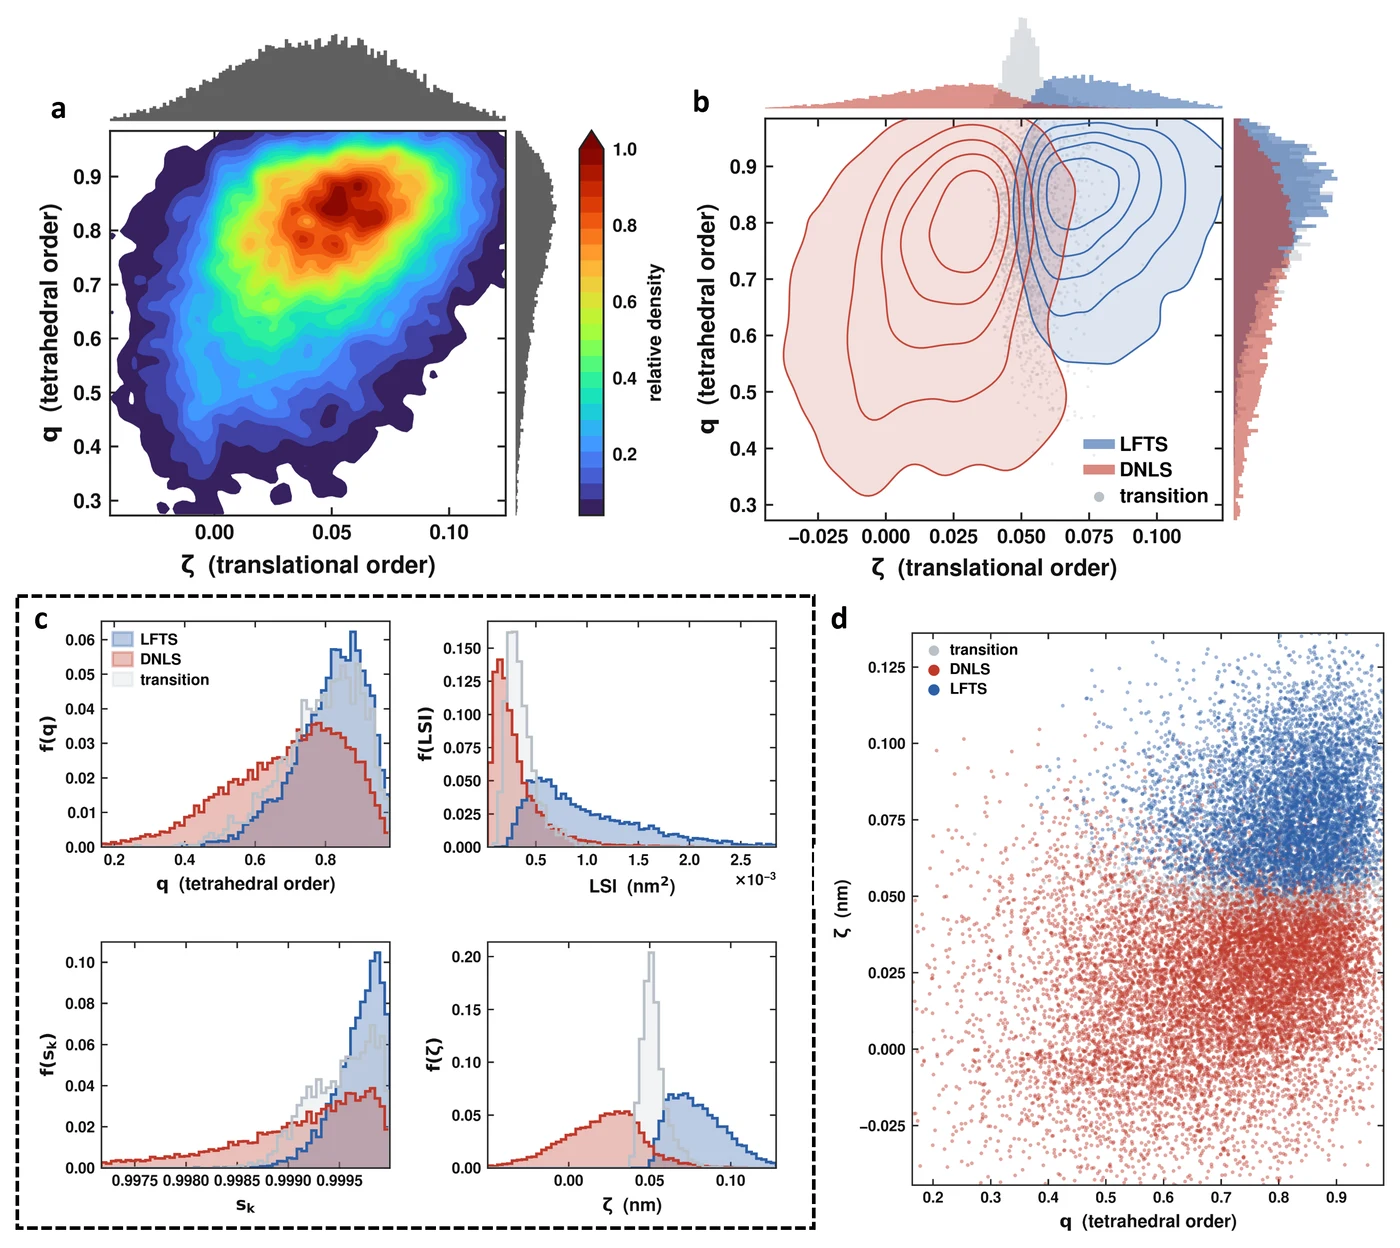
FIGURE A1: CLASSIFICATION AT −20 °CTIP4P/2005
The same molecules before and after classification in the q–ζ plane, each group's four order parameters, and the classified scatter: high-ζ (LFTS) in blue, low-ζ (DNLS) in red, transitional in grey.
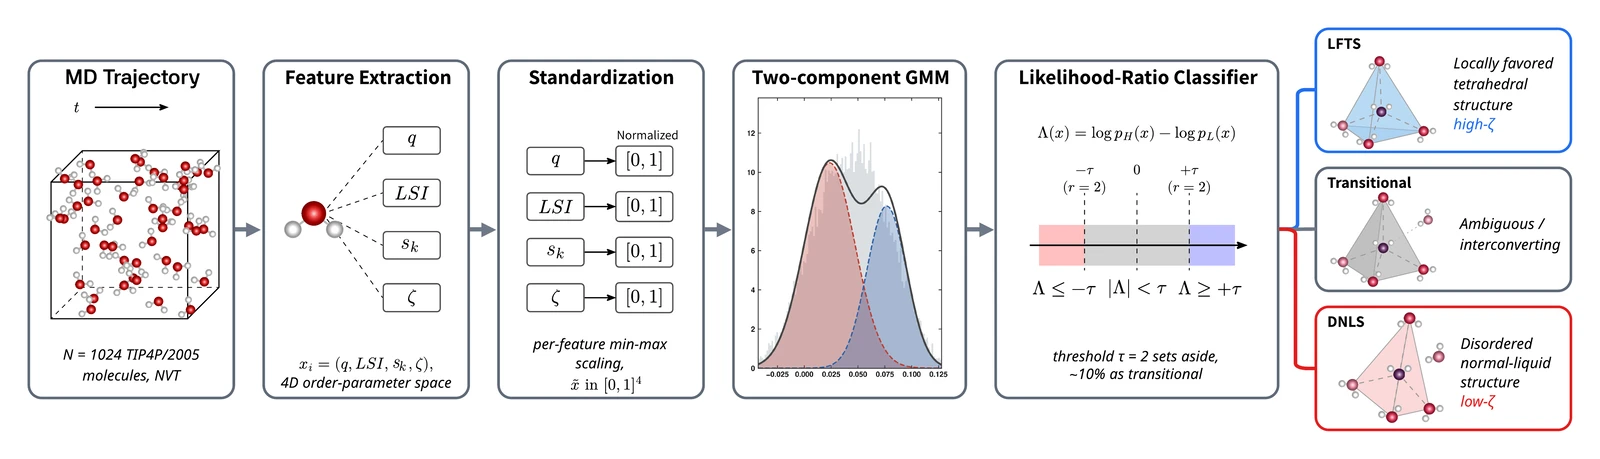
FIGURE A2: THE WORKFLOWONE TUNABLE PARAMETER
From the simulation to three groups: four order parameters per molecule, scaled to the range 0 to 1, a two-component Gaussian mixture, and the likelihood-ratio rule, whose threshold τ = 2 sets aside about 10% as transitional.
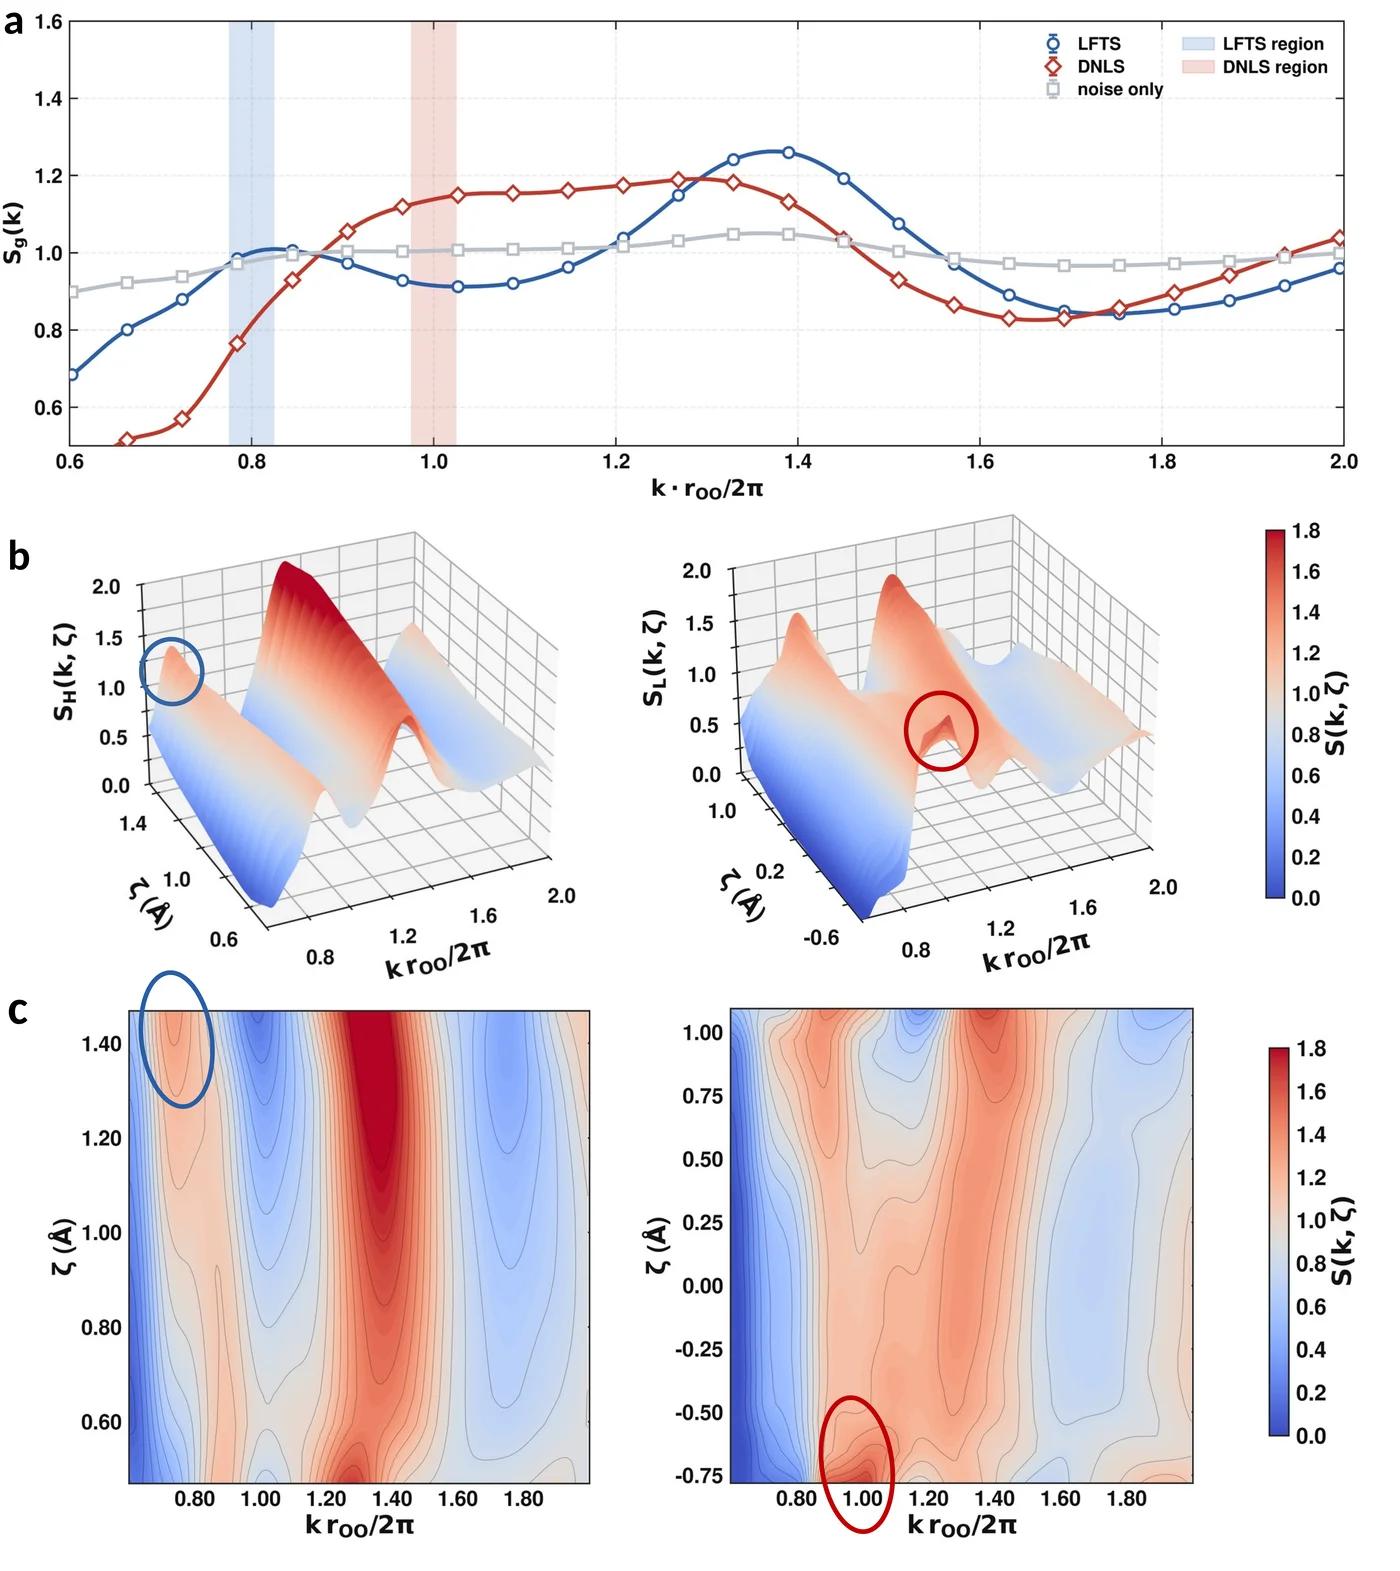
FIGURE A3: STRUCTURE FACTORS AT −20 °CPER GROUP
Each group's S(k): a first sharp diffraction peak near 0.82 for LFTS, an ordinary-liquid peak near 1.06 for DNLS, and a nearly flat curve for the transitional molecules; below, the same split resolved along ζ.
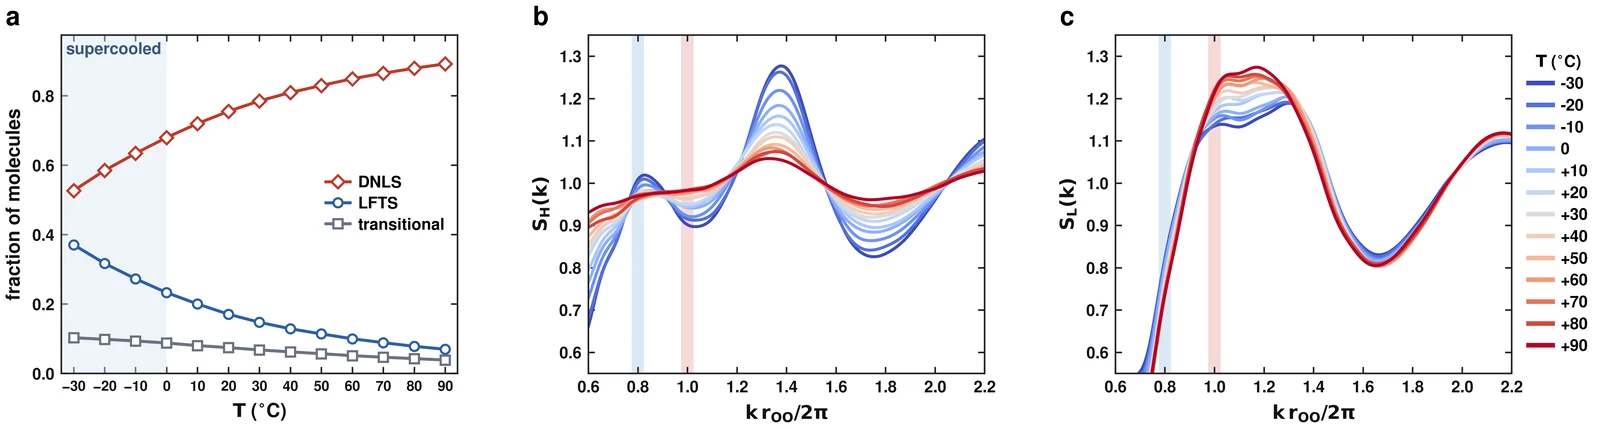
FIGURE A4: −30 TO +90 °CFIXED CLASSIFIER
The share of molecules in each state across the temperature range, and each state's S(k): the LFTS peak fades on warming while the DNLS curve barely changes.
*** END OF NOTE ***